
| 일 | 월 | 화 | 수 | 목 | 금 | 토 |
|---|---|---|---|---|---|---|
| 1 | 2 | 3 | 4 | 5 | ||
| 6 | 7 | 8 | 9 | 10 | 11 | 12 |
| 13 | 14 | 15 | 16 | 17 | 18 | 19 |
| 20 | 21 | 22 | 23 | 24 | 25 | 26 |
| 27 | 28 | 29 | 30 |
- 풀이
- 백트래킹
- Swift
- sigmoid
- dp
- NeuralNetwork
- Blockchain
- Greedy
- 부르트포스
- 실버쥐
- BFS
- 프로그래머스
- DeepLearning
- 캡스톤정리
- 플로이드와샬
- 알고리즘
- dfs
- C++
- ios
- Algorithm
- Stack
- ReLU
- mysql
- Node.js
- 그래프
- 백준
- Docker
- 탐색
- 문제풀이
- 그리디
- Today
- Total
목록Chart (2)
개발아 담하자
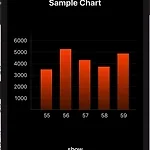 [iOS/Swift] Macaw 라이브러리 사용하기 (Animated Chart 그리기)
Swift로 Animated Chart 를 그려보자! 사용 라이브러리 : https://github.com/exyte/Macaw exyte/Macaw Powerful and easy-to-use vector graphics Swift library with SVG support - exyte/Macaw github.com 먼저 pod 설치를 해준다. (버전은 자주 바뀌므로 github 공식문서를 참고하자) pod "Macaw", "0,9,6" 1. Create Bar Struct struct SwiftNewsVideo { var showNumber: String // bar name var viewCount: Double // bar value } chart 에 그릴 정보를 담는 struct 이다. ba..
 [iOS/Swift] LineChart 를 사용해 그래프 그리기
Line Chart 를 swift 로 구현해보자! 1. Pod install 유용한 chart library 를 사용하자👇 https://github.com/danielgindi/Charts pod init pod 'Charts' pod install 2. Add View for Charts 원하는 크기의 UIView 를 추가한 다음 class 이름을 LineChartView 로 바꾼다. 3. Coding import Charts charts 를 import 시켜준다. var numbers: [Double] = [] numbers 는 chart 를 그릴 data 들의 배열이다. Double 형으로 선언해 주었다. var lineChartEntry = [ChartDataEntry]() // graph 에 ..